When Are Home Prices Going To Drop?
Post By: Kyle Weindel | December 12, 2022 | 5 Minute Read
Tell Your Friends:

As a real estate agent, a question that I’m getting from a lot of clients is “When are home prices expected to go down?” I want to show you how I analyze the major data points of the real estate market. Some of the data includes reviewing a buyers market vs a sellers market, interest rates, how fast a home sells and how much it sells for. This combination of data is how I advise my clients on navigating the ever changing market and could lead us to the answer of when they will go down.
- Months of Inventory
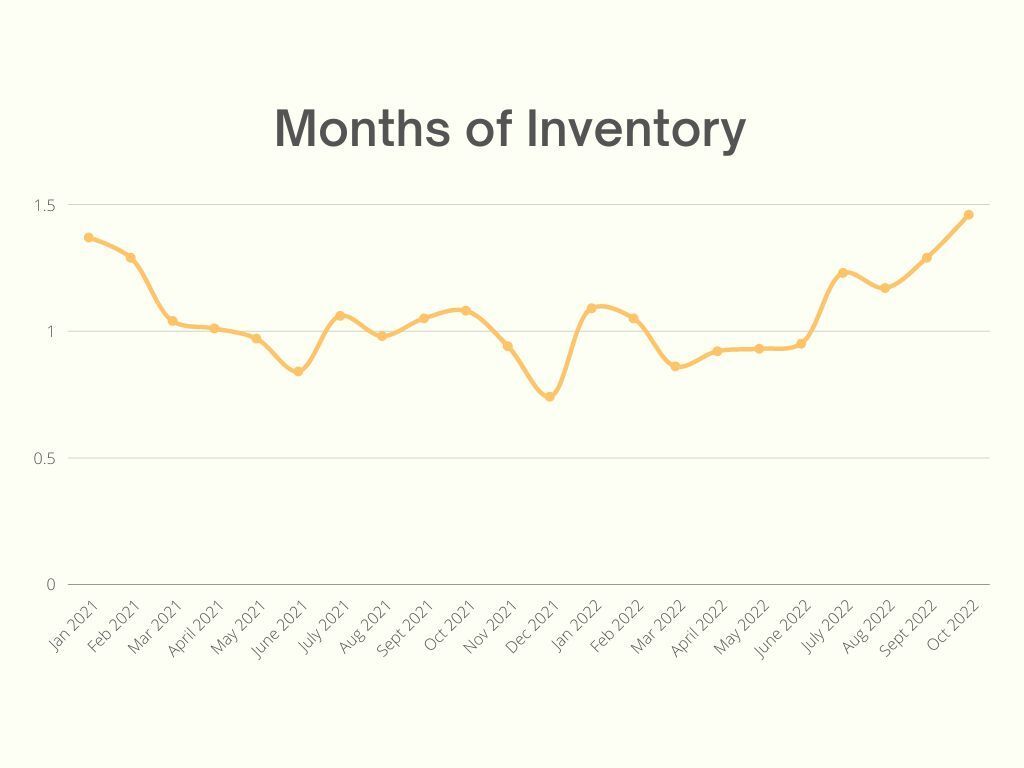
Here's one important piece of data that I look at. "Months of Inventory" tell us how much supply and demand is in the market. This measurement represents the number of months it would take for the current inventory of homes on the market to sell. If we have 4 months, that is considered a balanced market. Less than 4 months, is a seller's market, and greater than 4 months is a buyer's market. Right now, we have 1.46 months of inventory and in Dec of 2021 we only had .74 months of inventory!
2. Interest Rates
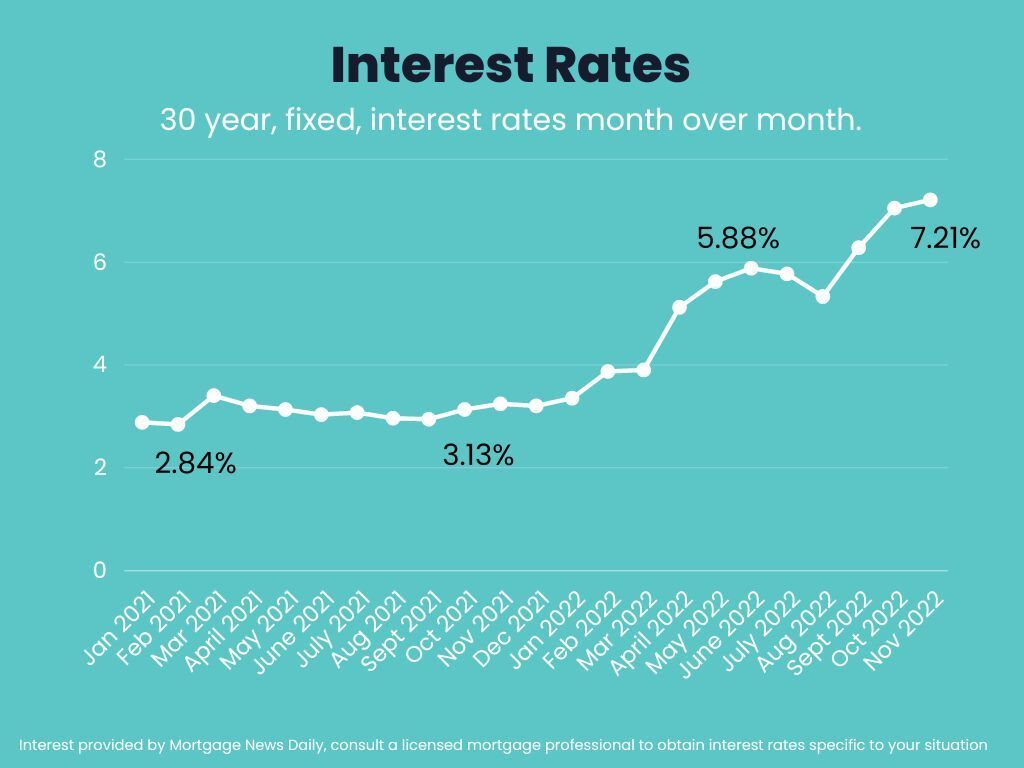
Interest rates are another piece of data we can use to estimate where the market is going. Interest rates on a 30-year, fixed mortgage will not only determine the buying power that my client has, but will also affect supply and demand of a market. The higher the interest rates climb, the less buyers can afford, and in some situations, it may turn an eligible buyer into an ineligible buyer. When there are less buyers in the market, home prices will drop.
3. List Price to Sale Price Ratio and Average Days on Market
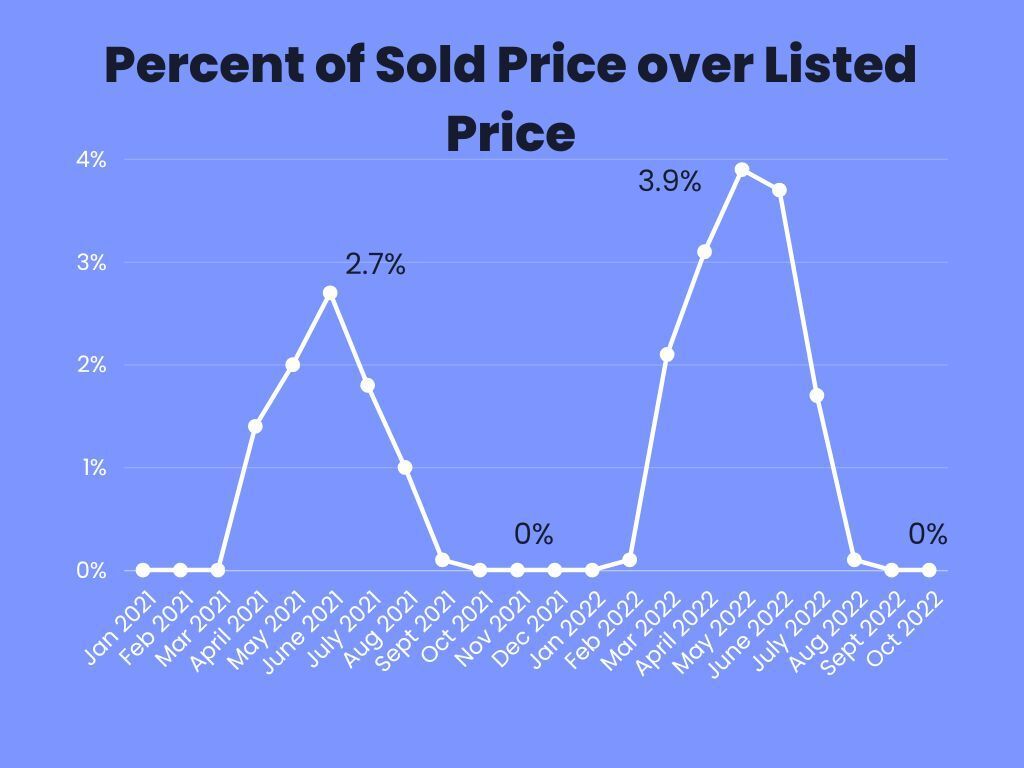
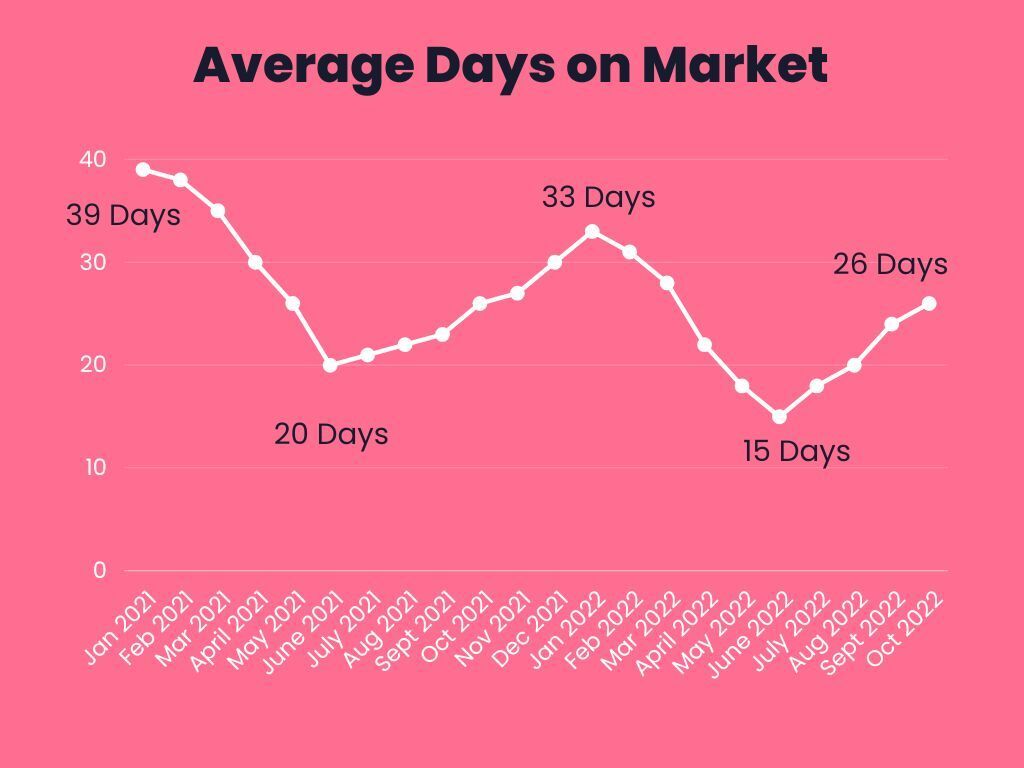
Looking at the list price to sale price ratio and the average days on the market helps us understand the current market conditions. If homes are selling well above the list price and quickly, then we are in a strong seller's market. If homes are selling below the list price and slowly, then we are in a buyer's market. Having an agent who understands market timing can save you money and make you tens of thousands of dollars during a real estate transaction. As you can see from the graphs below, when looking at how homes are selling compared to their listed price and how fast they are selling, we are currently only seeing traditional seasonality of the market. The last time the average home sold for less than listed price was February of 2020, before COVID.
4. Average Sale Price
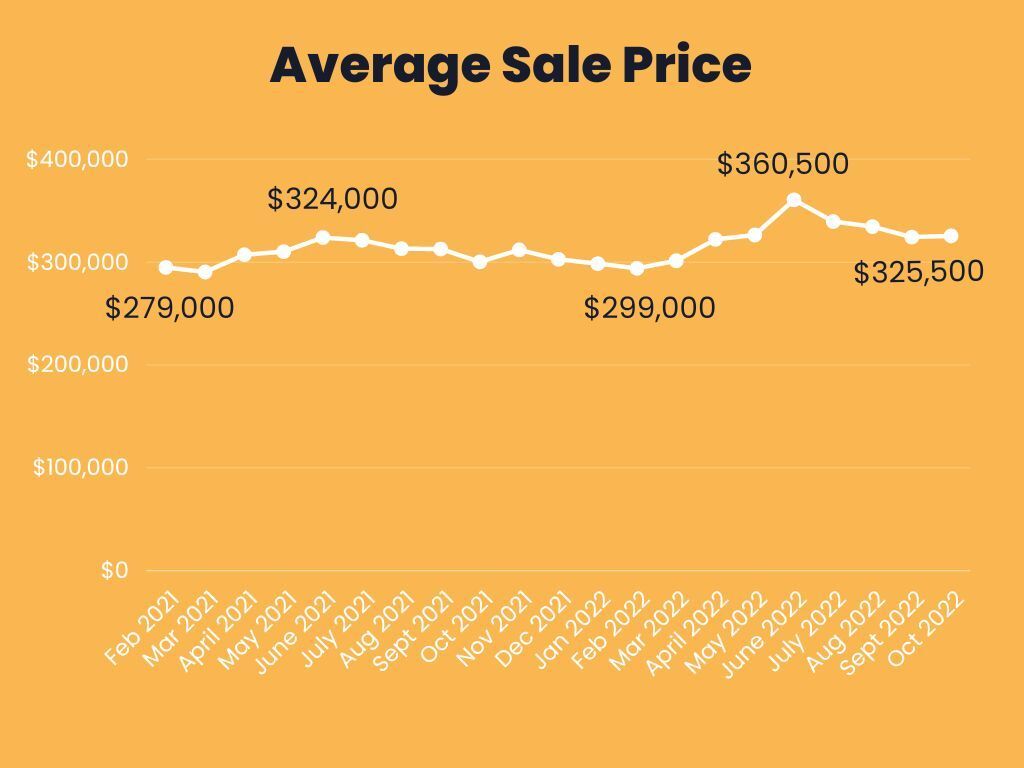
Obviously, what ultimately determines when home prices will decrease is when we start to see a reduction in the average sale price of a market. What you can see in the graph below is that we have seen a reduction in the average price of a home, but these are by no means record lows.
It’s extremely important to realize that the data I’ve been sharing is specific to St. Louis / St. Charles Missouri areas, which cover a broad range of homes. When you are buying or selling a home it’s critical that you understand how the market is performing in that subdivision and having an agent that can provide that data to you and help you understand it. If you or someone you know is thinking about buying, selling, building, or investing, I would love to help and appreciate any referrals.
Discover Your Home's True Value Today!
Access Exclusive
Off-Market Properties
Join our insider list to discover hidden gems before they hit
the market.
Access Exclusive Off-Market Properties
Interested in Learning More?
Sign-up For My Newsletter!
When you sign up for my newsletter, you'll Receive a FREE copy of "An Evidence Based Approach to a Successful Home Sale."
Contact Us


